
Apr 29, 2025
OVT Overlay Shares Short Term Bond ETF
Passive short-term bond exposure with active risk-managed put selling option overlay that seeks to generate additional income
★★★★
Morningstar Rating™
Overall rating based on risk-adjusted returns among 517 funds in the Short Term Bond category as of 6/30/26.
6.54%
Distribution Rate**
4.55%
30-Day SEC Yield
The Distribution Rate represents the annualized most recent monthly distribution divided by the Fund’s NAV as of 6/30/26. It is not a measure of total return. Distributions may include return of capital and are not guaranteed. The Fund’s distribution rate may vary.
Performance data quoted represents past performance and is no guarantee of future results. Investment return and principal value of an investment will fluctuate so that an investor's shares, when redeemed, may be worth more or less than their original cost. Current performance may be lower or higher than the performance data quoted.
Invest in OVT
Investing on your own?
Search for the OVT ticker on your trading platform, or click one of these links for quick access:
Working with a professional?
Email your financial professional to discuss how Overlay Shares OVT can help power your portfolio.
Email your advisor
Questions about ETFs?
If you have general questions about Overlay Shares ETFs, we are here to help.
770.350.8700
The Overlay Shares ETFs are distributed by Foreside Fund Services, LLC. The distributor is not affiliated with the Adviser.
Liquid Strategies LLC serves as Investment Adviser to the Funds and manages the Overlay Strategies.
Liquid Strategies LLC (“Liquid”) is an independent investment adviser registered under the Investment Advisers Act of 1940, as amended. Registration does not imply a certain level of skill or training. More information about Liquid, including our investment strategies, fees and objectives, can be found in our Form ADV Part 2A and our Form CRS.
Overlay Shares are traded on all major stock exchanges. Contact us to discuss.

ETFs can be bought and sold throughout the trading day offering liquidity and ongoing valuations of the fund's holdings for investors. ETFs are typically tax-efficient and generally have lower cost than other investment alternatives, making them a great investment tool for investors. Trading can be executed through your financial advisor or an account with most brokerage firms. Commissions and transaction costs may vary so be sure to check on these costs.
The Overlay Shares Short Term Bond ETF seeks to achieve total return through a combination of capital appreciation and income generation.
Quick Links

Invest in OVT
Investing on your own?
Search for the OVT ticker on your trading platform, or click one of these links for quick access:
Working with a professional?
Email your financial professional to discuss how Overlay Shares OVT can help power your portfolio.
Email your advisor
Questions about ETFs?
If you have general questions about Overlay Shares ETFs, we are here to help.
770.350.8700
The Overlay Shares ETFs are distributed by Foreside Fund Services, LLC. The distributor is not affiliated with the Adviser.
Liquid Strategies LLC serves as Investment Adviser to the Funds and manages the Overlay Strategies.
Liquid Strategies LLC (“Liquid”) is an independent investment adviser registered under the Investment Advisers Act of 1940, as amended. Registration does not imply a certain level of skill or training. More information about Liquid, including our investment strategies, fees and objectives, can be found in our Form ADV Part 2A and our Form CRS.
Overlay Shares are traded on all major stock exchanges. Contact us to discuss.
ETFs can be bought and sold throughout the trading day offering liquidity and ongoing valuations of the fund's holdings for investors. ETFs are typically tax-efficient and generally have lower cost than other investment alternatives, making them a great investment tool for investors. Trading can be executed through your financial advisor or an account with most brokerage firms. Commissions and transaction costs may vary so be sure to check on these costs.
Fund Performance
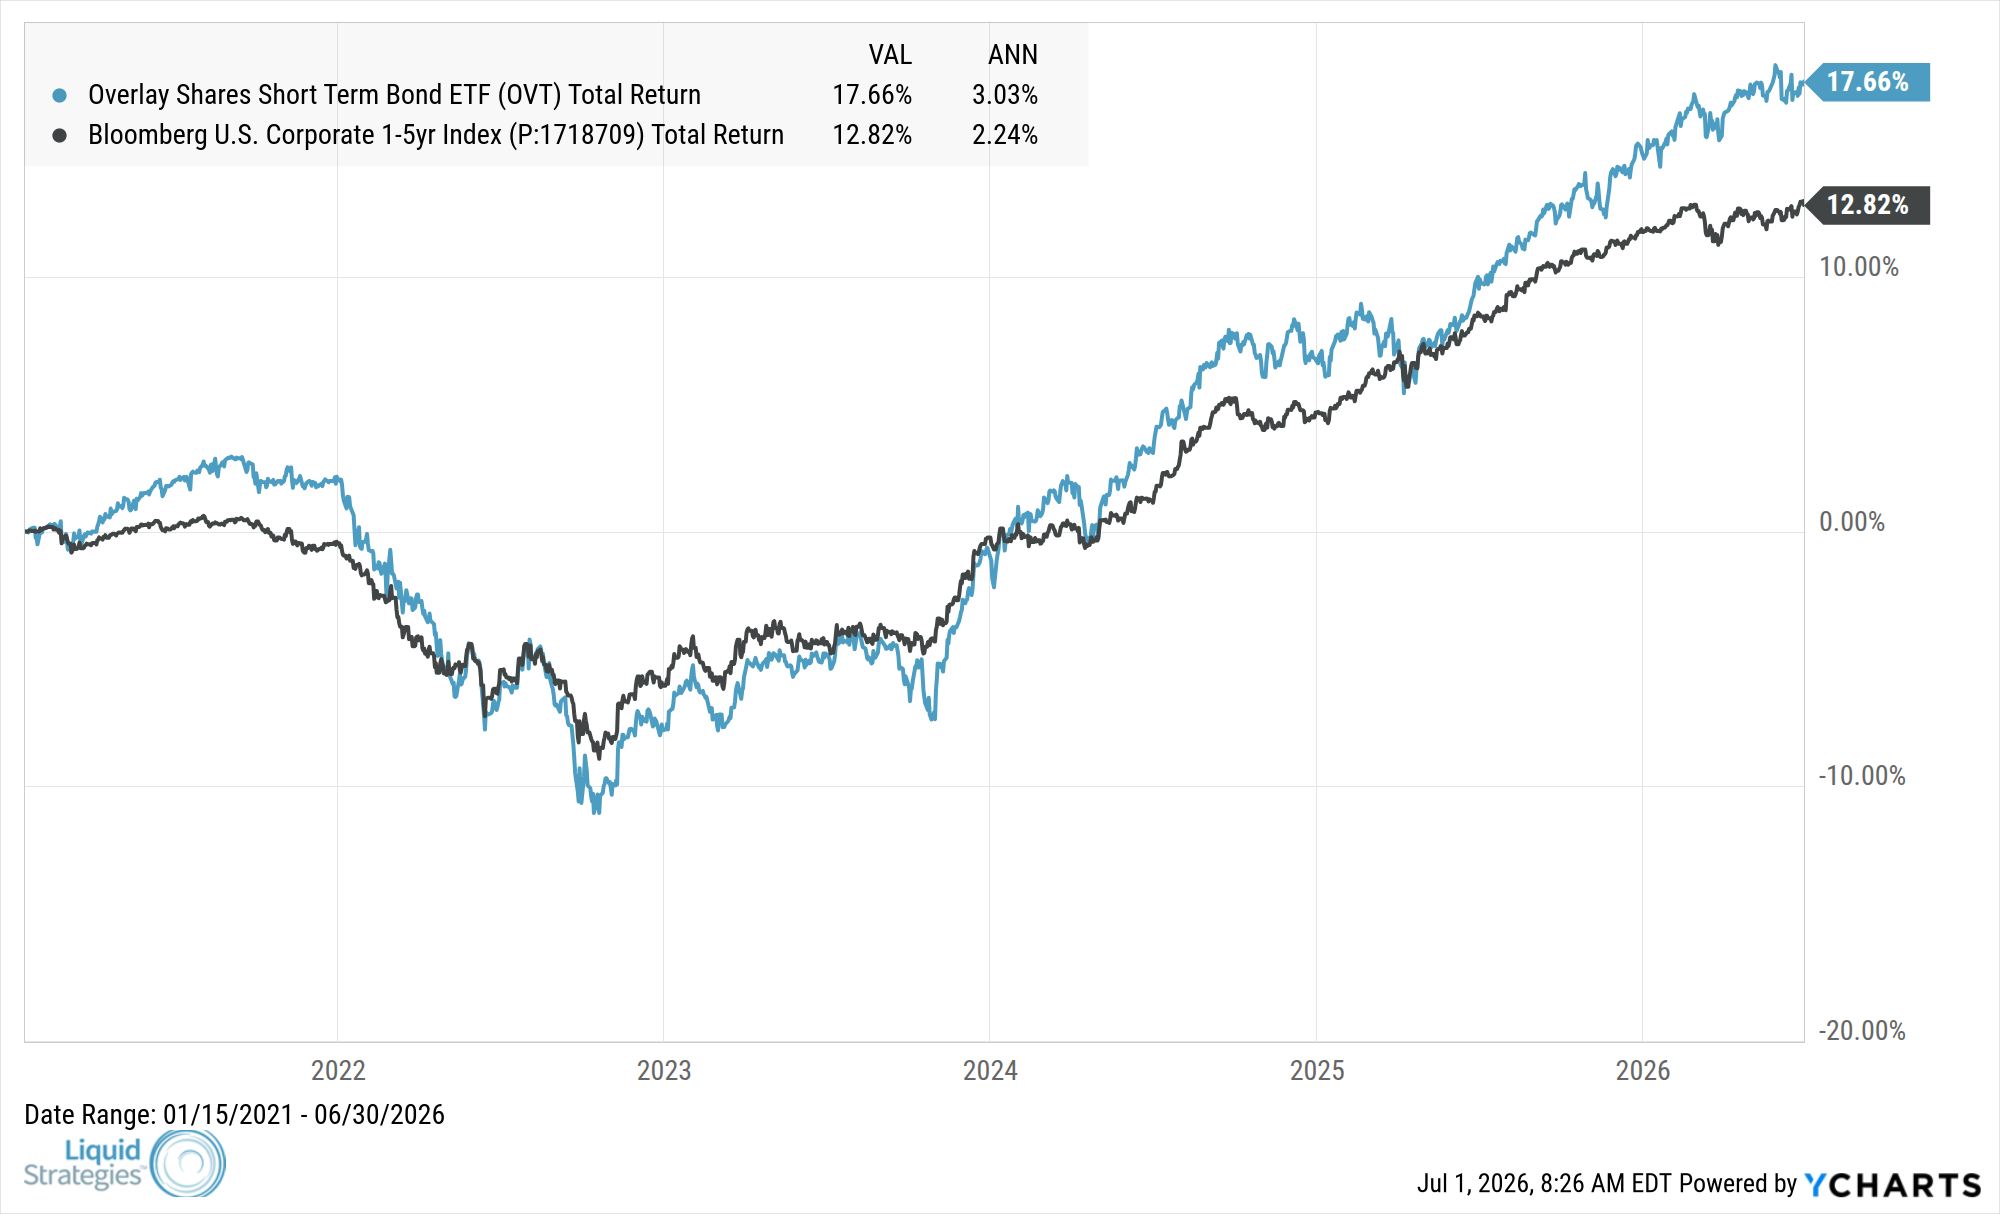
Data as of June 30, 2026
| 1MO | 3MO | 6MO | YTD | 1YR | 3YR | 5YR | Since Inception | |
|---|---|---|---|---|---|---|---|---|
| OVT NAV Returns | -0.34% | 1.24% | 2.66% | 2.66% | 7.21% | 7.31% | 2.90% | 3.03% |
| OVT Market Price Returns | -0.55% | 1.24% | 2.47% | 2.47% | 6.96% | 7.31% | 2.90% | 3.03% |
| Bloomberg U.S. Corporate 1-5 years Index | 0.14% | 0.84% | 0.93% | 0.93% | 3.85% | 5.70% | 2.43% | 2.26% |
Performance of less than one year is cumulative. Performance greater than one year, including since inception, is annualized. You cannot invest directly in an index.
Performance data quoted represents past performance and is no guarantee of future results. Investment return and principal value of an investment will fluctuate so that an investor's shares, when redeemed, may be worth more or less than their original cost. Current performance may be lower or higher than the performance data quoted. For the most recent month-end performance, please call 1-866-704-OVLS.
Overlay Shares are bought and sold at market price (not NAV) and are not individually redeemed from the Fund. Total Returns are calculated using the daily 4:00pm EST net asset value (NAV). Market price returns reflect the midpoint of the bid/ask spread as of the close of trading on the exchange where Fund shares are listed. Market price returns do not represent the returns you would receive if you traded shares at other times.